Widgets
This is a quick tour of the widgets you'll use most. Open any of them from the menu bar, then drag, resize, and link them into your workspace — see The TickForge window.
Charts
A TickForge chart shows live candles (or a line / bars) with a volume histogram and a crosshair. The strip across the top reads out Last, change, Bid, Ask, Volume, and the session High, Low, Open, and Close. Use the toolbar to change the symbol, pick a timeframe (1m, 15m, …), switch the chart type, or open the Draw menu for trendlines, Fibonacci levels, and price labels. Open as many charts as you need from the Charts menu, and link a chart to a color group so it follows your active symbol.
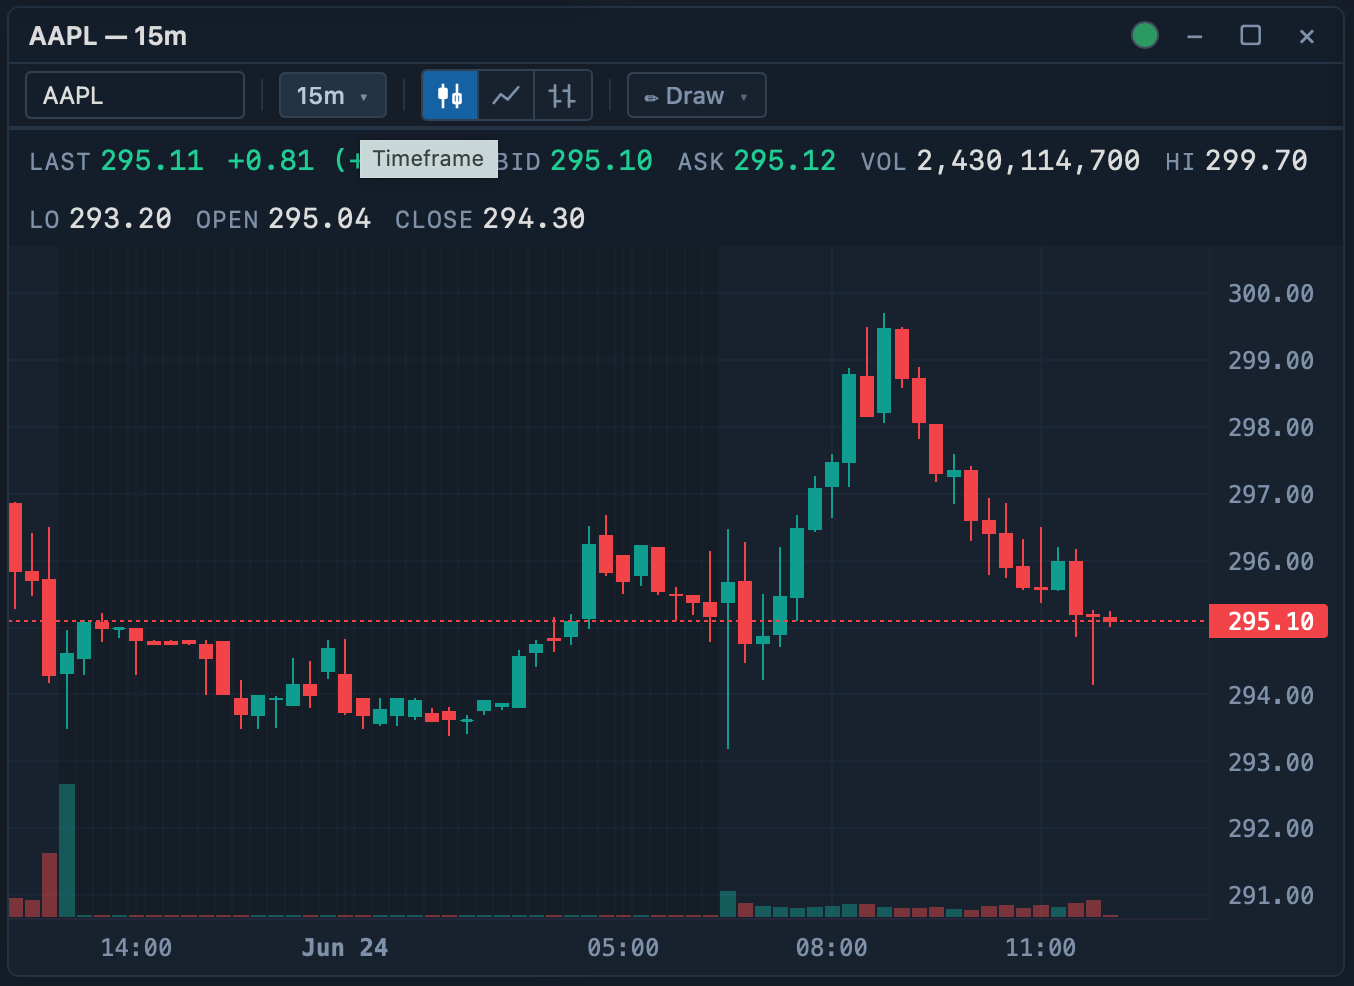
A 15-minute chart. Regular charts carry the symbol, timeframe, chart-type, and Draw controls.
The Primary Chart
One chart can be promoted to the Primary Chart, marked with a ⚡ badge in its title bar. It's your main trading chart and adds two things regular charts don't have:
- Indicators — overlay studies and sub-panes (SMA, EMA, VWAP, Bollinger Bands, RSI, MACD) from the Indicators menu.
- Trade arrows — Buy/Sell markers on the bars where you entered and exited this symbol. The Trade arrows toggle switches between just your current position and every fill of the session.
The current bar's volume is also shown as a small Vol tag in the bottom-left of the Primary Chart.
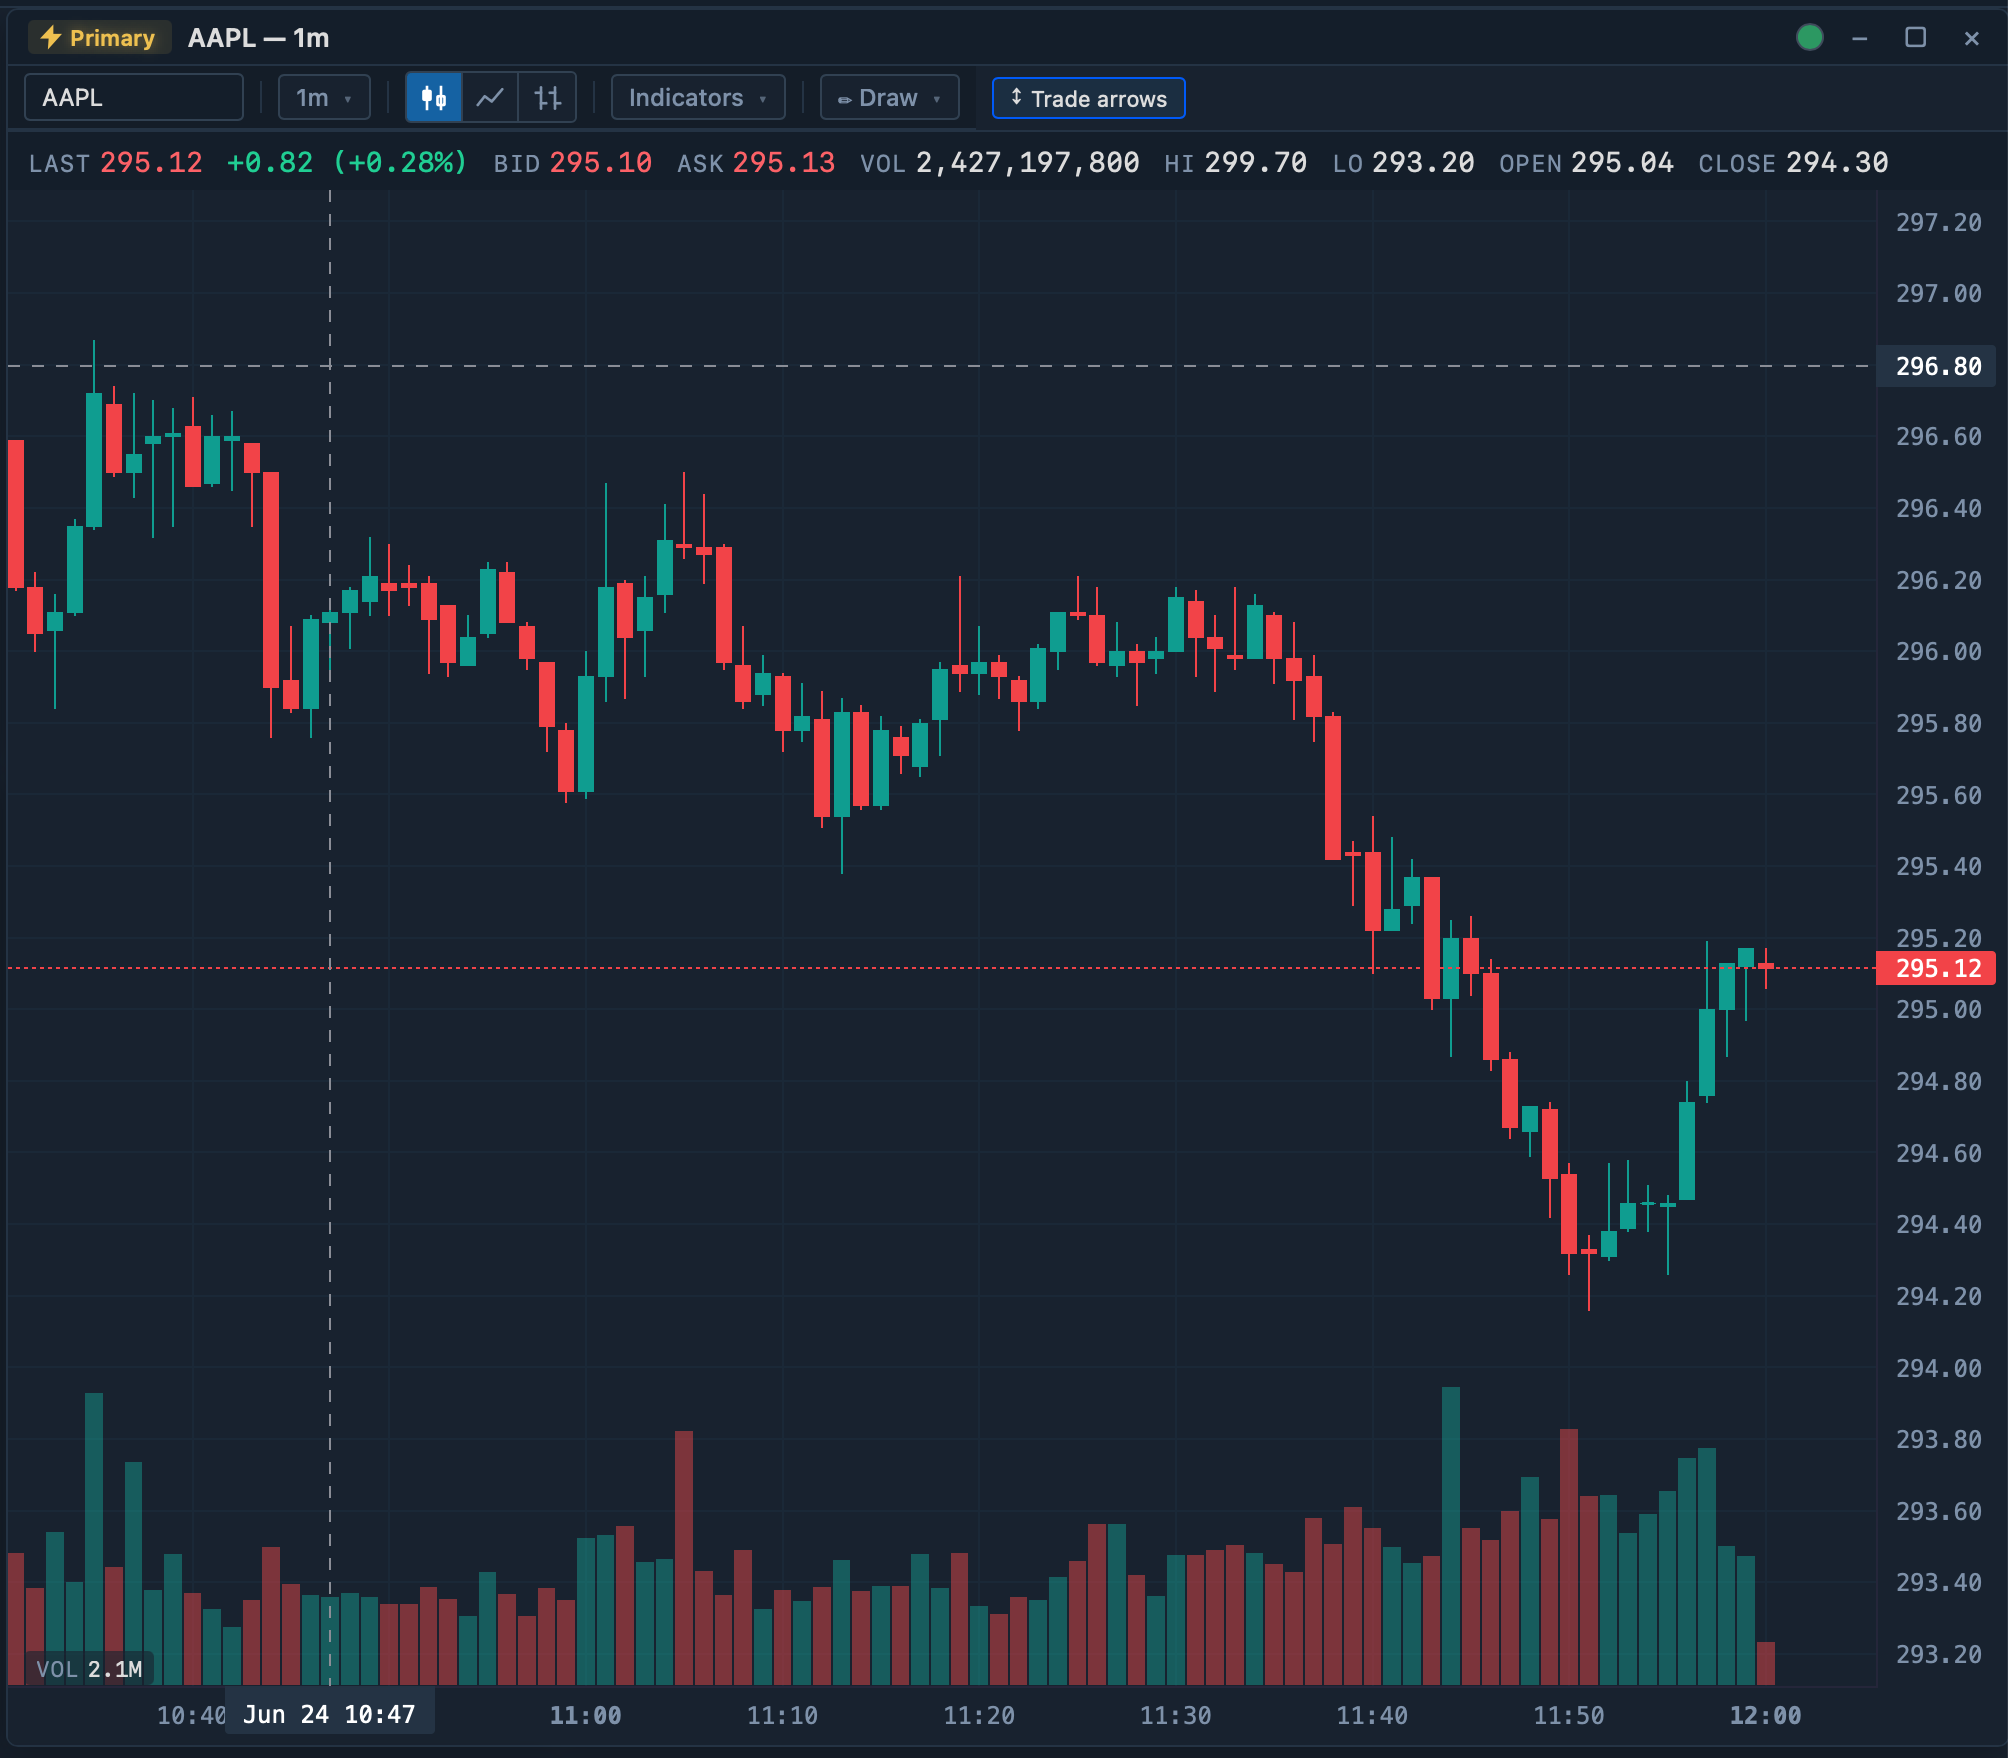
The Primary Chart (⚡ badge) on a 1-minute timeframe, with the Indicators and Trade-arrows controls that regular charts don't show.
Watchlist
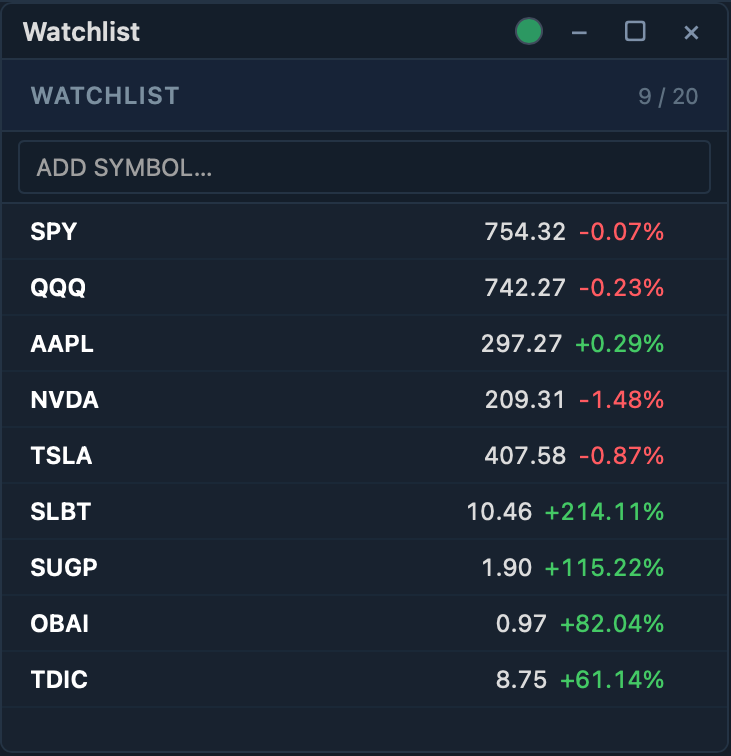
A compact, live quote list. Type a symbol in the toolbar to add it (up to 20 per watchlist), and the header shows how many slots are used. Each row updates in real time with last price, change, and percent change. You can also add a symbol straight from a scanner with the ★ button.
Scanner
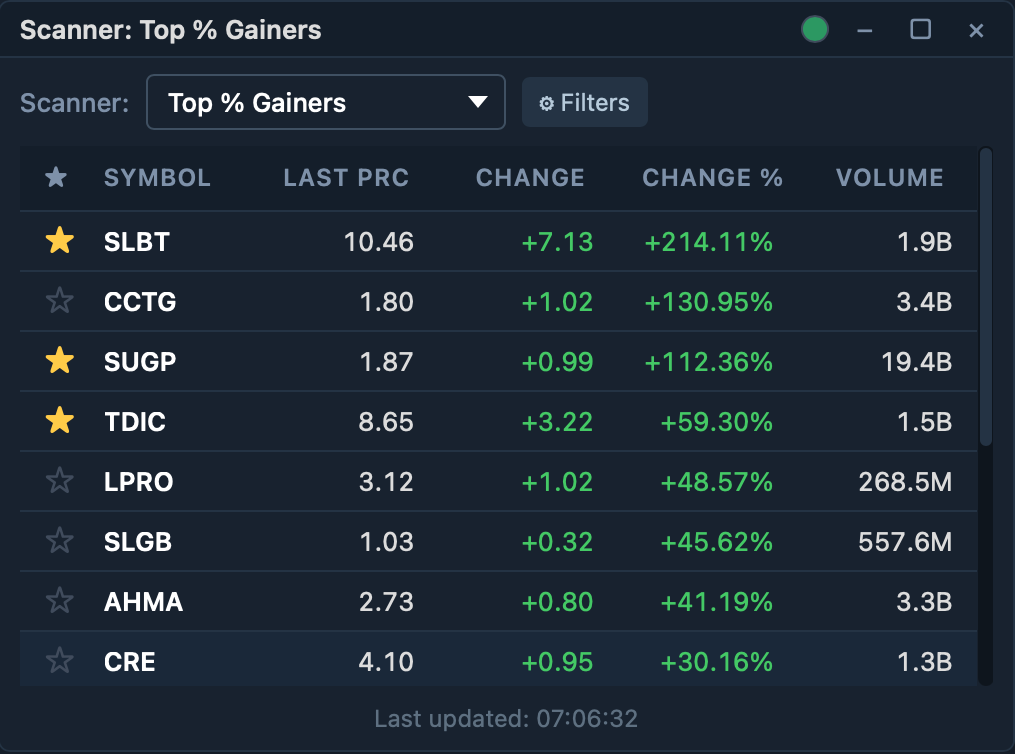
Surfaces the day's movers using Interactive Brokers' market scanners — Top % Gainers, Top % Losers, Most Active, Hot by Volume, and more. Narrow the results with the Min/Max price and Min volume filters. Tune the refresh interval, result count, and how many scanners run at once under Settings → Scanner.
Order Entry
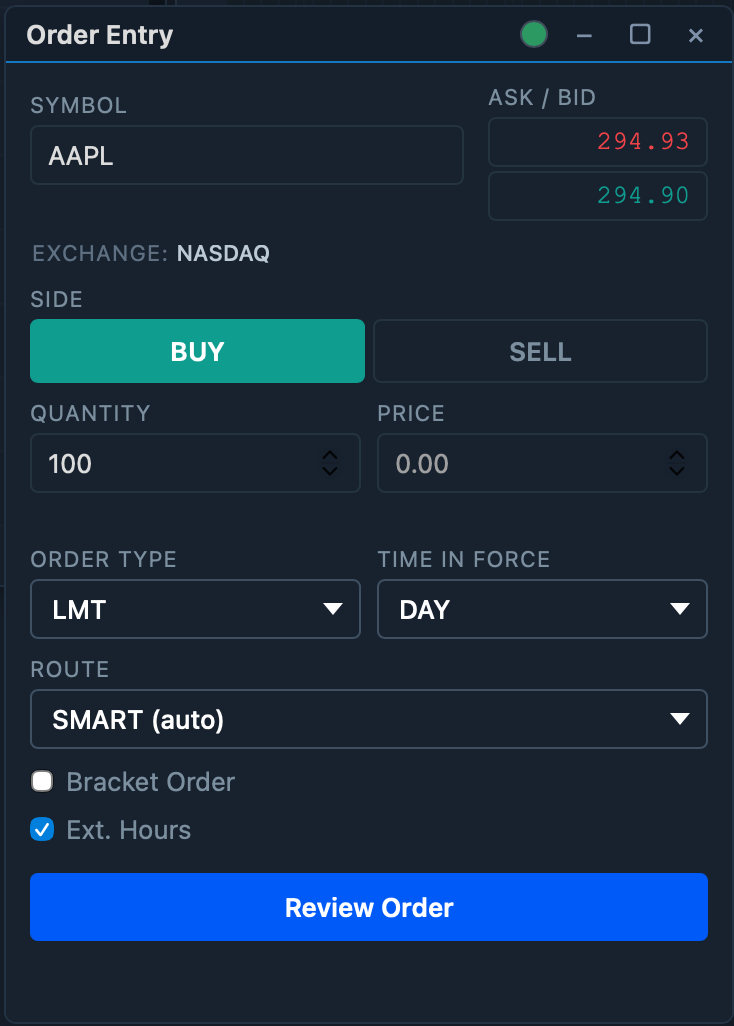
Where you place trades. Set the Symbol (or let a link group set it for you), then pick Buy or Sell, a Quantity, an Order Type (Market, Limit, Stop, Stop-Limit), a Price when the type needs one, and a Time in Force (DAY, GTC, IOC, FOK). The live Ask / Bid and the symbol's Exchange show at the top. A few extra options:
- Route — leave it at SMART (auto) to let IBKR route the order, or choose a direct exchange (ARCA, NASDAQ, …) if you've enabled direct routing in Settings → Trading.
- Bracket Order — attach a take-profit and a stop-loss to the entry.
- Ext. Hours — let the order work in the pre- and post-market.
Click Review Order to confirm before it's sent. For one-keystroke trading, see Script keys.
Positions & Trades
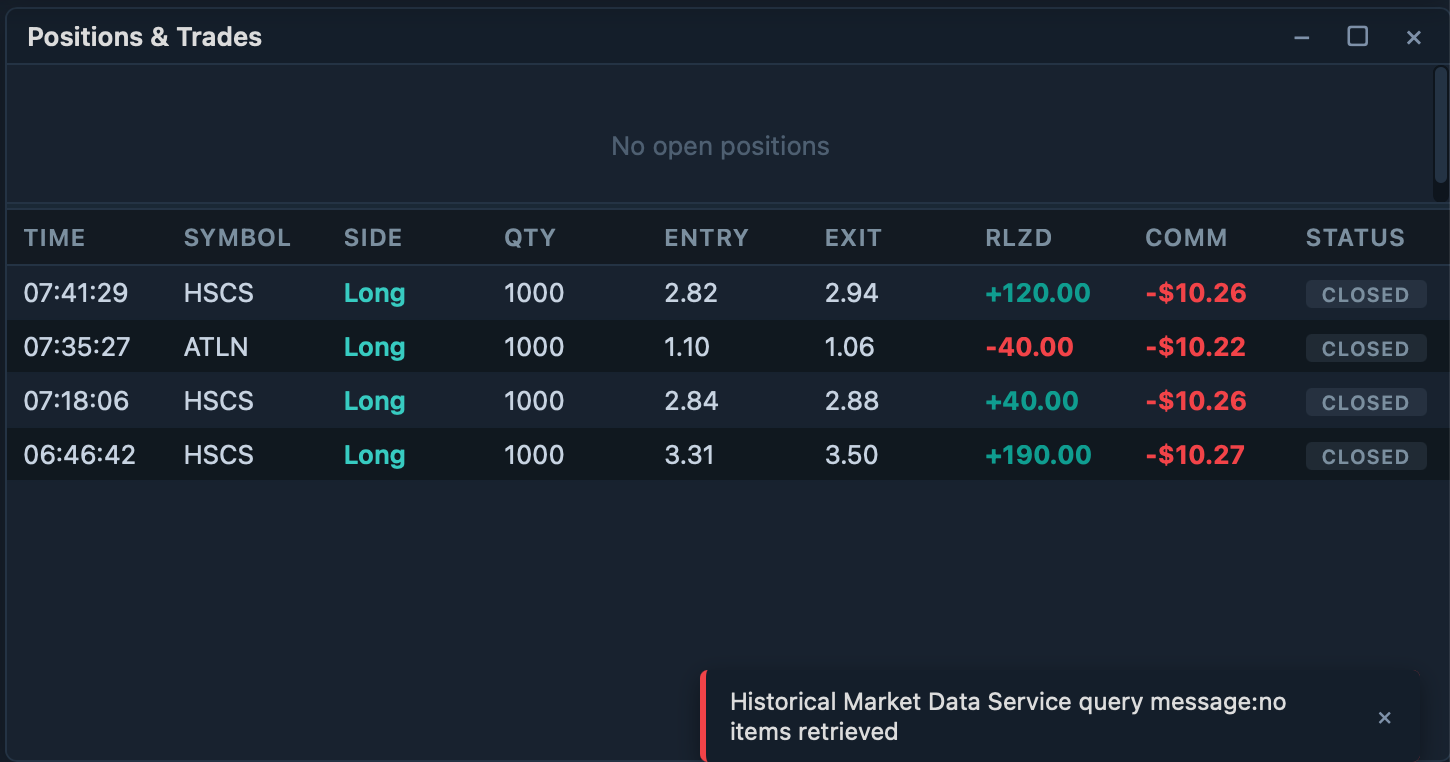
Two panels in one widget. The top lists your open positions — quantity, average cost, market value, and unrealized P&L — with a per-row Flatten button. The bottom is your trade blotter: a newest-first log of fills with entry, exit, realized P&L, and commissions.
Orders
Your order book, split into four tabs — Open, Filled, Cancelled, and Rejected — each with a count badge. Every row shows the time, symbol, side, quantity, type, price, and status.
Open
Working orders that haven't filled yet. This is the only tab with an Action column: modify or cancel a working order right from its row.
Filled
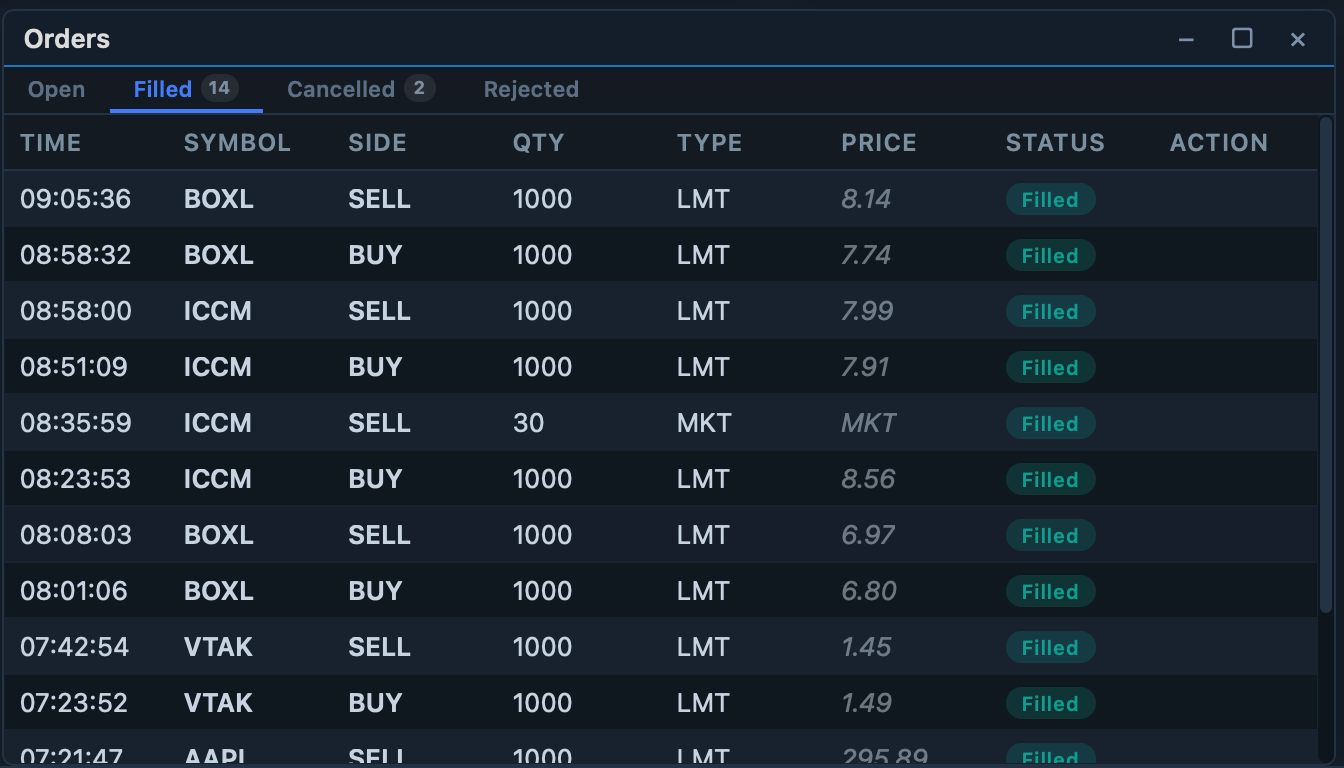
Your completed orders for the session, newest first, each with its fill price and a Filled badge. Filled orders are final, so there's no action to take — it's your execution history at a glance.
Cancelled
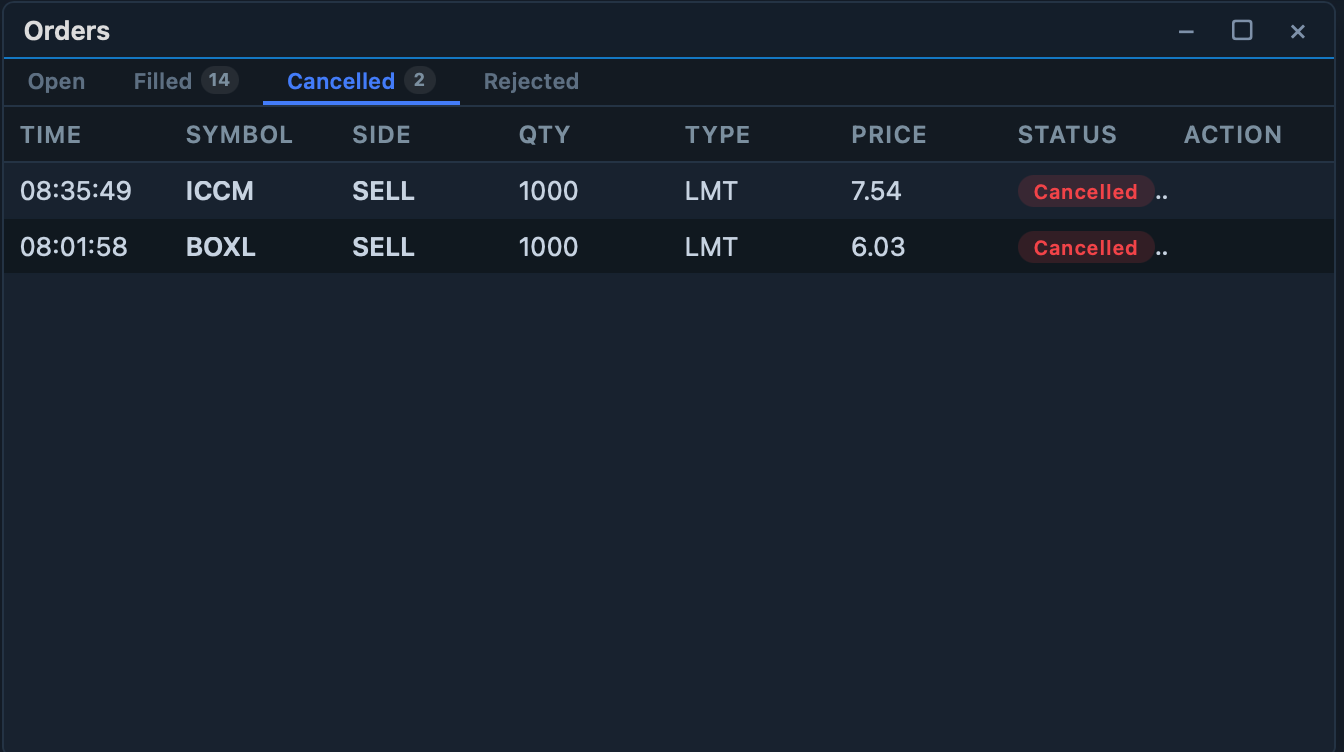
Orders that were cancelled before they filled, marked with a Cancelled badge. Like filled orders, these are terminal and kept for reference.
Rejected
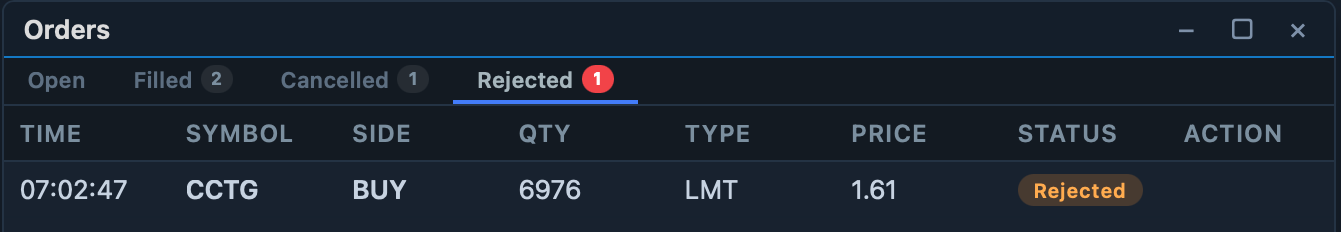
The Rejected tab lists rejected orders with their time, symbol, side, and size — but not why they were rejected. To see the broker's reason, open the System Log widget and read the message logged for that order.
News
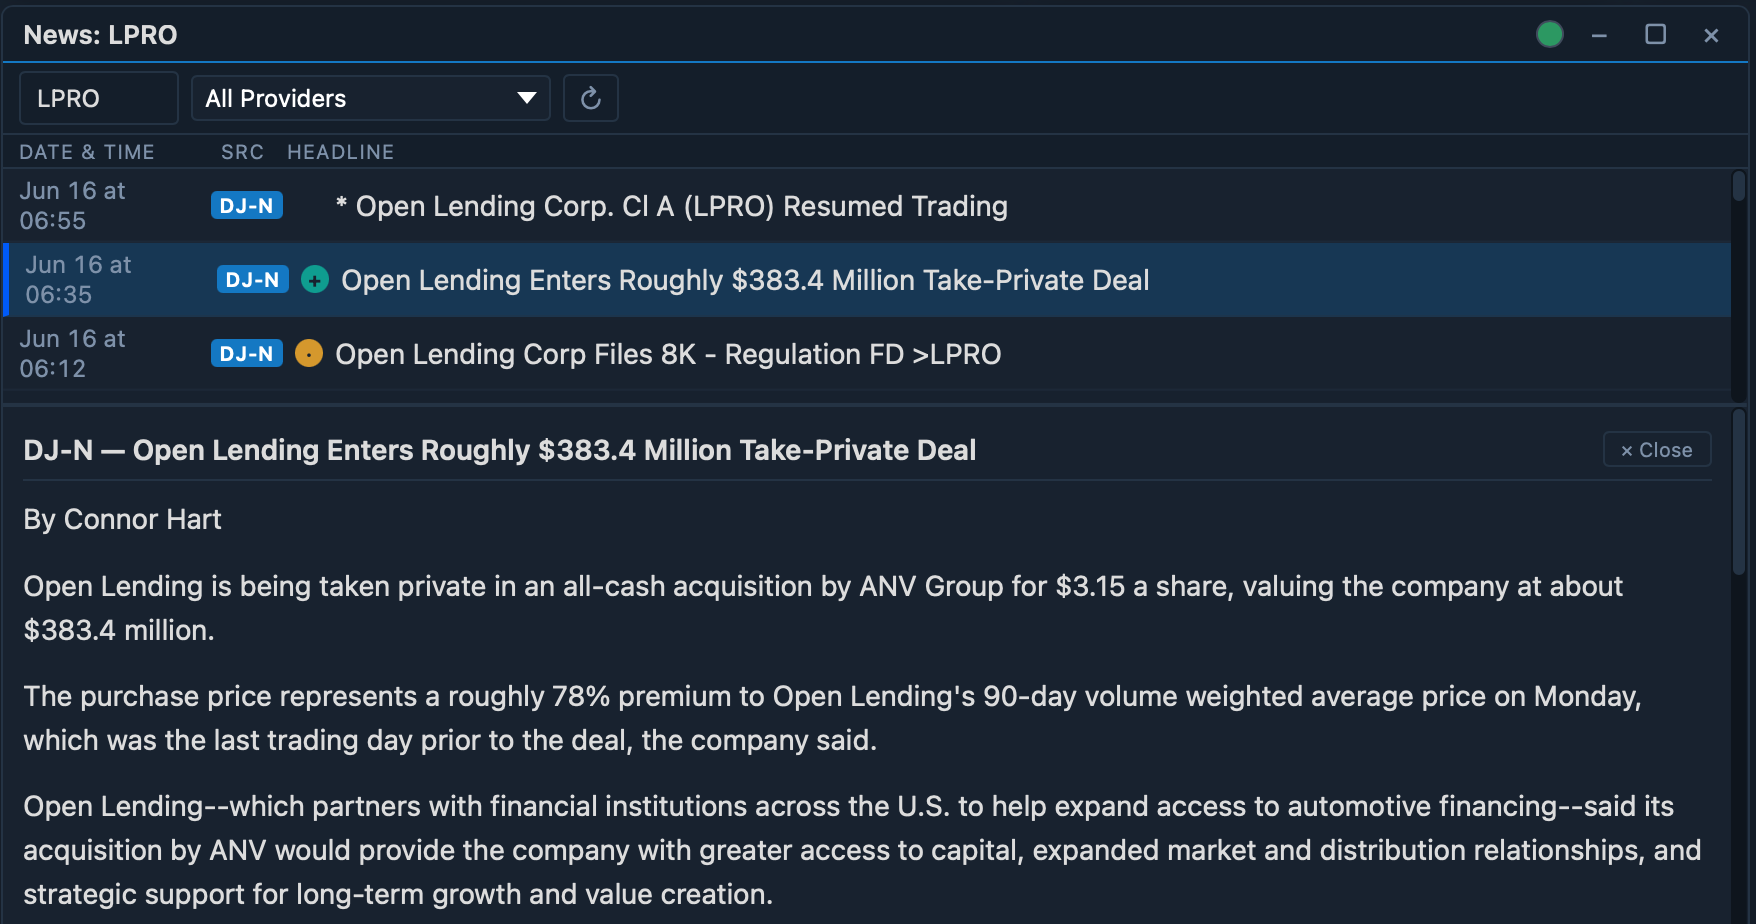
Headlines for the active symbol, newest first, with the date, source, and headline. Filter by provider or refresh on demand. Link the widget to a color group so it follows your symbol selection automatically.
Fundamentals
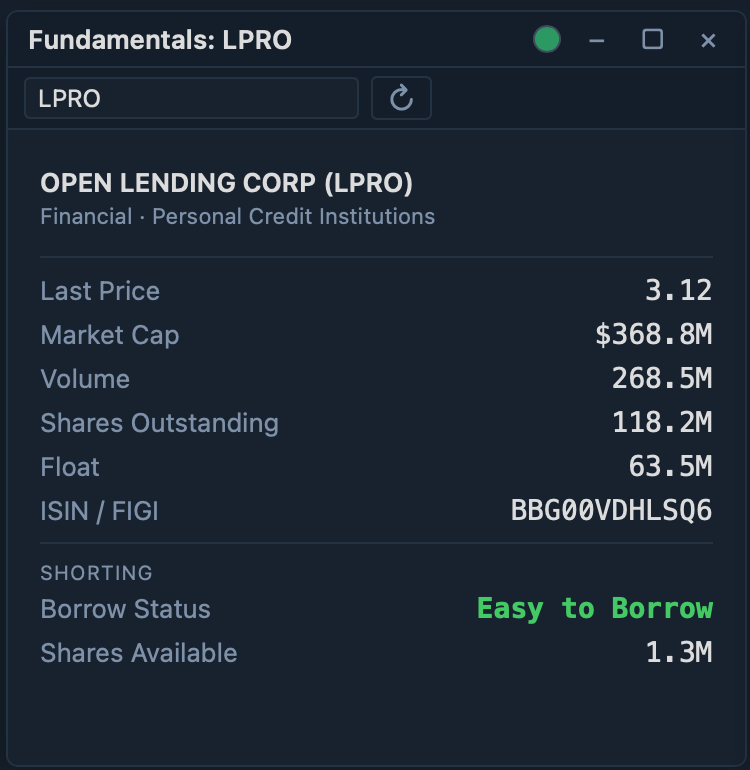
A snapshot of the active symbol: last price, market cap, volume, estimated shares outstanding, identifiers, and short-selling availability (easy to borrow / locate required / hard to borrow, with shares available), plus a short company description.
System Log
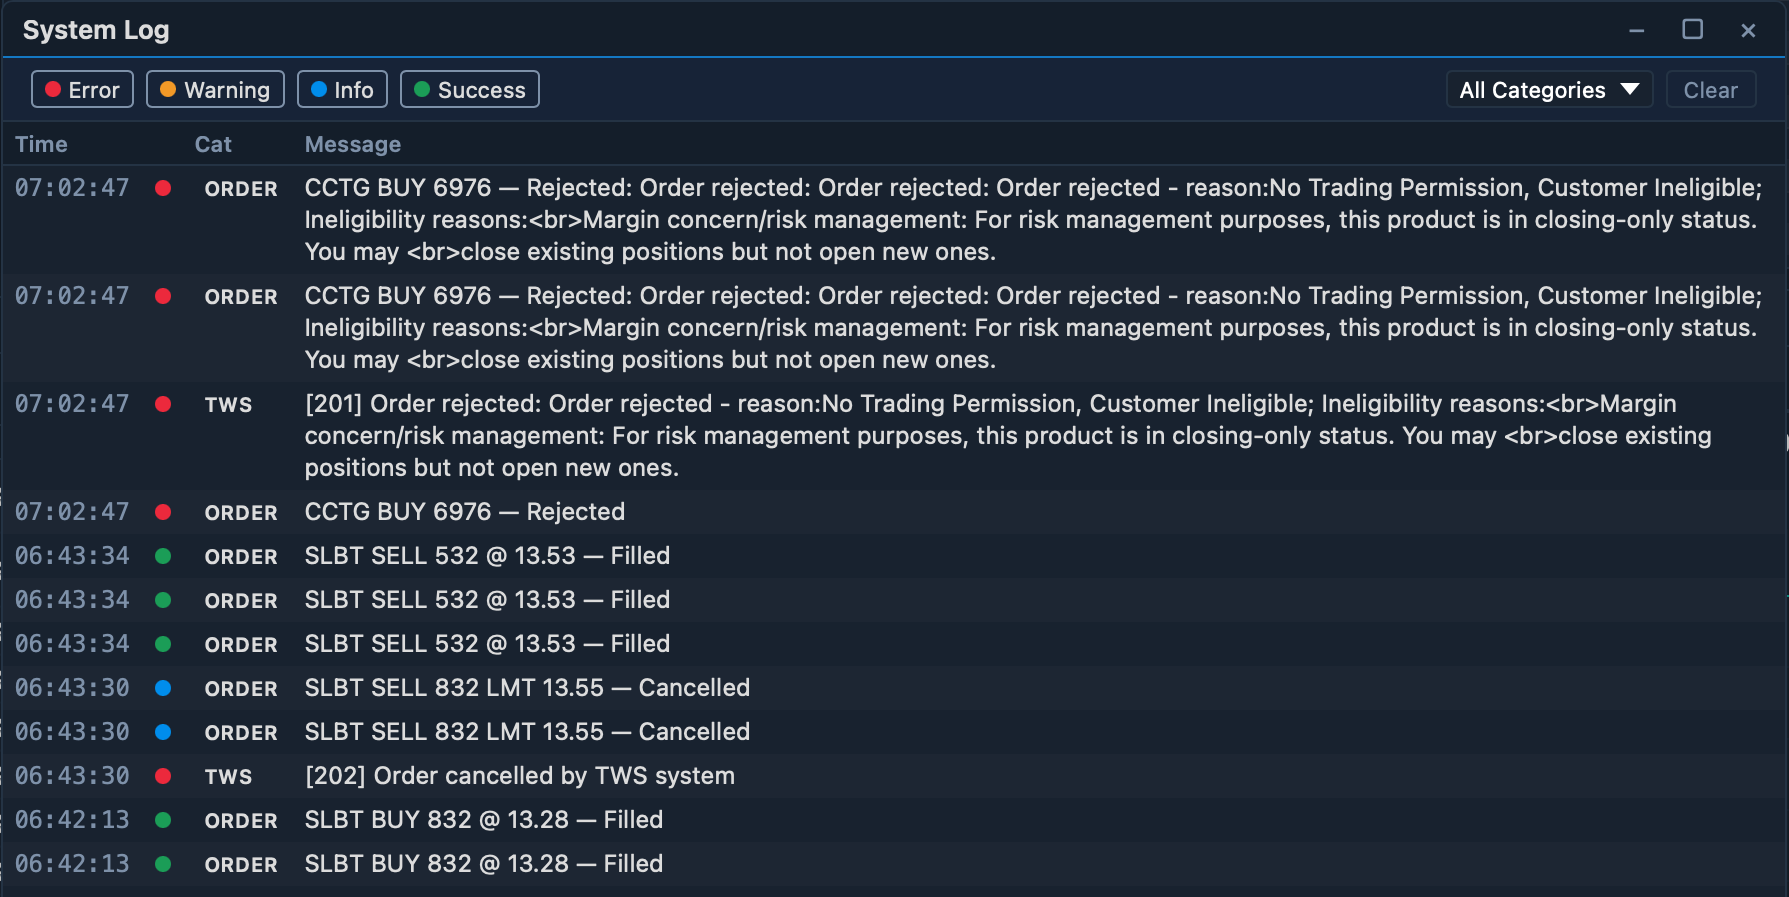
A running record of what TickForge is doing — connection events, order activity, and warnings. Filter by severity (error, warning, info, success) and category (TWS, Order) to find what you need, or clear the log.
Where to next
- Settings — configure these widgets and your trading defaults.